Operating solar PV capacity: the selected total
This is our state aggregation of EIA’s August 2026 generator inventory, using only photovoltaic records explicitly marked (OP) Operating. It covers the 50 states and District of Columbia. It does not measure all installed solar or electricity generated.
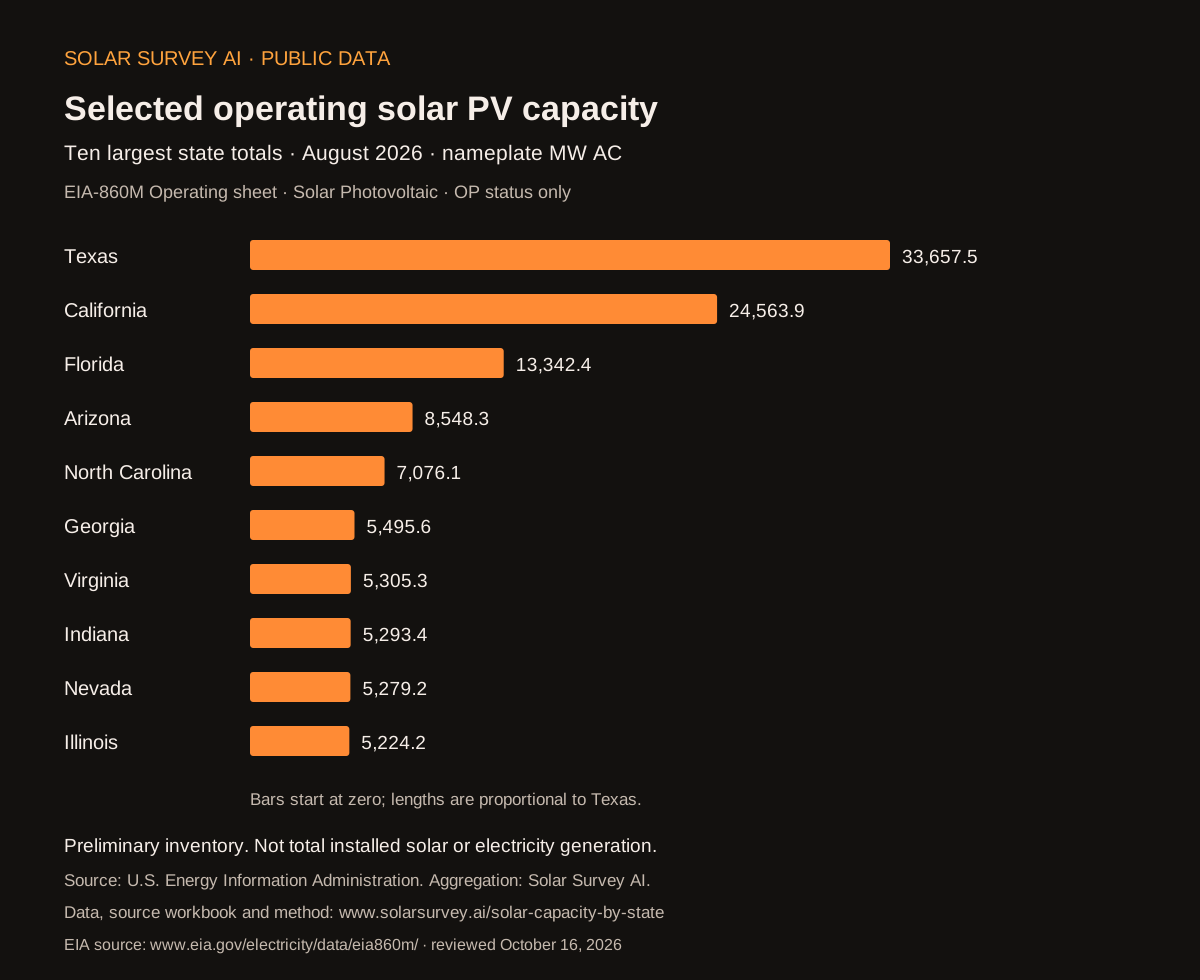
Texas leads this selection at 33,657.5 MW AC. California follows at 24,563.9 MW AC. These ranks compare one capacity measure within one dated selection; they are not a ranking of rooftop adoption, energy output or the best state for a project.
The ten largest state totals in this selection
Bars are proportional to Texas, the largest state total in this selection. Values show nameplate MW AC, rounded to 0.1 MW. Select a state name for its table row.
Compare all states and DC
Use a state name or its two-letter abbreviation. The ranking and percentage denominator stay national when you filter. With JavaScript unavailable, all 51 rows remain readable.
Showing 51 jurisdictions.
| Rank | State / DC | MW AC | Share of selected total | Distinct plants | Generator records |
|---|---|---|---|---|---|
| 1 | Texas | 33,657.5 | 20.09% | 242 | 256 |
| 2 | California | 24,563.9 | 14.66% | 972 | 1,148 |
| 3 | Florida | 13,342.4 | 7.96% | 225 | 225 |
| 4 | Arizona | 8,548.3 | 5.10% | 126 | 167 |
| 5 | North Carolina | 7,076.1 | 4.22% | 769 | 798 |
| 6 | Georgia | 5,495.6 | 3.28% | 154 | 157 |
| 7 | Virginia | 5,305.3 | 3.17% | 144 | 149 |
| 8 | Indiana | 5,293.4 | 3.16% | 126 | 127 |
| 9 | Nevada | 5,279.2 | 3.15% | 68 | 105 |
| 10 | Illinois | 5,224.2 | 3.12% | 456 | 464 |
| 11 | Ohio | 4,875.5 | 2.91% | 78 | 81 |
| 12 | Utah | 3,454.4 | 2.06% | 59 | 62 |
| 13 | Colorado | 3,291.2 | 1.96% | 187 | 192 |
| 14 | New Mexico | 3,291.0 | 1.96% | 111 | 114 |
| 15 | New York | 3,187.5 | 1.90% | 737 | 757 |
| 16 | Michigan | 3,085.1 | 1.84% | 77 | 78 |
| 17 | Arkansas | 2,791.3 | 1.67% | 73 | 73 |
| 18 | Wisconsin | 2,554.2 | 1.52% | 118 | 122 |
| 19 | Minnesota | 2,172.9 | 1.30% | 546 | 727 |
| 20 | South Carolina | 1,999.0 | 1.19% | 129 | 130 |
| 21 | Missouri | 1,897.8 | 1.13% | 38 | 39 |
| 22 | Mississippi | 1,724.5 | 1.03% | 26 | 26 |
| 23 | Louisiana | 1,555.9 | 0.93% | 21 | 21 |
| 24 | Massachusetts | 1,505.2 | 0.90% | 557 | 572 |
| 25 | Oregon | 1,462.2 | 0.87% | 152 | 152 |
| 26 | Maryland | 1,387.6 | 0.83% | 208 | 212 |
| 27 | Kentucky | 1,375.7 | 0.82% | 21 | 21 |
| 28 | New Jersey | 1,300.7 | 0.78% | 355 | 417 |
| 29 | Tennessee | 1,243.6 | 0.74% | 54 | 56 |
| 30 | Pennsylvania | 1,207.3 | 0.72% | 80 | 83 |
| 31 | Oklahoma | 1,184.9 | 0.71% | 23 | 23 |
| 32 | Alabama | 986.3 | 0.59% | 15 | 15 |
| 33 | Maine | 959.9 | 0.57% | 175 | 176 |
| 34 | Idaho | 826.6 | 0.49% | 14 | 15 |
| 35 | Iowa | 700.6 | 0.42% | 37 | 37 |
| 36 | Hawaii | 578.0 | 0.35% | 35 | 57 |
| 37 | Connecticut | 501.5 | 0.30% | 95 | 102 |
| 38 | Rhode Island | 451.5 | 0.27% | 77 | 85 |
| 39 | Kansas | 434.4 | 0.26% | 39 | 39 |
| 40 | Washington | 348.4 | 0.21% | 10 | 10 |
| 41 | West Virginia | 259.3 | 0.15% | 6 | 6 |
| 42 | Wyoming | 242.0 | 0.14% | 2 | 2 |
| 43 | South Dakota | 217.3 | 0.13% | 4 | 4 |
| 44 | Montana | 181.0 | 0.11% | 9 | 10 |
| 45 | Nebraska | 159.8 | 0.10% | 28 | 29 |
| 46 | Vermont | 155.5 | 0.09% | 54 | 54 |
| 47 | Delaware | 134.9 | 0.08% | 26 | 28 |
| 48 | District of Columbia | 35.2 | 0.02% | 17 | 18 |
| 49 | Alaska | 7.7 | 0.00% | 2 | 18 |
| 50 | New Hampshire | 4.4 | 0.00% | 2 | 2 |
| 51 | North Dakota | No qualifying records | — | 0 | 0 |
Shares use the 167,517.7 MW AC selected total and are rounded independently. A plant can contain several generators. North Dakota has no qualifying records in this selection; that does not mean it has no solar installations. Counts include only the selected PV records.
How to read the numbers
A share of capacity is not a share of electricity
For example, Texas’s 33,657.5 MW AC divided by the 167,517.7 MW AC selected total is approximately 20.09%. That describes this capacity inventory. It does not say that 20.09% of U.S. solar electricity was generated there.
MW and MWh answer different questions. Capacity describes a power rating. Generation measures energy over a period. This table has no generation or household-consumption data, so it cannot establish homes powered, bill savings or a state’s solar share of electricity.
AC and DC are different rating bases. We sum the workbook’s Nameplate Capacity (MW) column, on the EIA AC reporting basis. We do not sum DC Net Capacity or substitute Net Summer Capacity. See EIA’s explanation of AC and DC solar capacity and its capacity-measures advisory.
Source, method and exclusions
Source: EIA preliminary monthly generator inventory, August 2026 workbook, released September 24, 2026. This is an independent aggregation by Solar Survey AI, not an EIA endorsement.
- Read the Operating worksheet and verify its inventory month and column headers.
- Select Technology = Solar Photovoltaic and Status = (OP) Operating. Other technologies, including solar thermal, are excluded.
- Sum Nameplate Capacity (MW) by Plant State using decimal arithmetic. Do not require coordinates and do not filter out generators merely because an individual unit is smaller than 1 MW.
- Count unique Plant ID + Generator ID pairs as generator records. Count distinct Plant IDs separately. Validate missing values, duplicates, state codes and nonnegative capacities; do not turn missing inputs into zero.
- Round state and national capacity sums to 0.1 MW after aggregation. Reconcile all state totals and counts with a second read-only workbook reader. Rank by capacity, with equal totals sharing a rank.
The Operating worksheet also contains 20 PV generator records marked out of service, totaling 47.1 MW AC. We exclude 15 OA records (42.0 MW) and 5 OS records (5.1 MW), rather than treating the worksheet name alone as proof of OP status.
Coverage limits: EIA-860M covers plants with at least 1 MW of combined nameplate capacity; that is a plant threshold, not a minimum for every generator. This is not a complete rooftop-solar inventory. Planned, retired, canceled and Puerto Rico worksheets are excluded. Monthly capacity estimates are preliminary and can change. These figures do not establish capacity commitments, future construction, generation or project suitability.
Source workbook SHA-256: b4b70abb4c217e8e2658c3bde7608a3d530e86a81279ccc572ced82a200e9f1c
Reproduce the selection using the linked EIA workbook and the steps above. The downloadable JSON includes state totals, counts, selection rules, source hash and the status audit. The source workbook and EIA’s documentation remain the authority if an interpretation differs.
Download and cite the state data
Use the CSV for a spreadsheet or analysis tool, the JSON for the full selection and status audit, or the SVG for a chart that retains its date, unit and source labels. Downloads contain the full national selection even when the table above is filtered.
A citation that keeps the scope clear
Suggested citation:
Solar Survey AI. “Operating solar PV nameplate capacity by state, August 2026.” Independent aggregation of the U.S. Energy Information Administration’s preliminary EIA-860M Operating worksheet, Solar Photovoltaic records with OP status. Reviewed October 16, 2026. https://www.solarsurvey.ai/solar-capacity-by-state
Keep the inventory month, MW AC unit and OP-status selection with any quoted figure. Credit EIA for the source inventory and Solar Survey AI for this aggregation. If you need all installed solar or electricity generated, use the corresponding EIA series rather than relabelling these figures.
CSV field guide
- inventory_month
- The source inventory month, YYYY-MM.
- state_code / state
- Two-letter postal code and state name, including District of Columbia.
- rank / nameplate_mw_ac
- National rank and selected nameplate capacity, rounded to 0.1 MW AC. Both are blank for North Dakota because the selection has no qualifying records there. This is not evidence of no solar in the state.
- distinct_plants / generator_records
- Separate counts of selected Plant IDs and unique Plant ID + Generator ID pairs. Zero means no selected records; it is not a count of rooftop systems.
- qualifying_records_present
- true or false for whether this selection contains records for the jurisdiction.
- technology / status
- Solar Photovoltaic and OP. These selection fields travel with each row.
- source_workbook_url / source_workbook_sha256 / aggregation_url
- The source file, its version-identifying checksum and this method page.
Use the data for the right question
Researchers and editors can use this table for a dated comparison of operating PV capacity in the selected inventory. Installers, EPCs and asset owners still need property-level evidence before scoping a project. State totals cannot tell you a roof’s condition, a site’s shade, interconnection requirements or the right equipment.
Continue with solar energy, power and ratings, utility-scale survey services or our survey methodology. Discuss the project’s evidence needs and confirm the service scope before ordering a survey.
Editorial disclosure: Solar Survey AI is a commercial survey-services company and may benefit if readers purchase its services. This resource uses public EIA data and our own calculations; it contains no customer project data.