Residential

OverviewRooftop PV at volumeRoof & dronePlanes measured on the roofAttic & structureRafters recordedElectricalPanel and interconnectionDesign & engineeringModel to stamped set

Commercial & Industrial

OverviewBig roofs, real structureOn-site surveyRoof, structure, switchgearDesign & engineeringPE stampedVisual inspectionModule resolutionThermal inspectionFaults as heatElectroluminescenceCell-level cracks

Utility-Scale

OverviewThousands of acresLiDAR topographyTerrain before earthworkLand surveyingBoundary and topographicConstruction monitoringProgress, measuredThermal & ELEvery string

Across every scale

Site surveysRoof and electrical, one visitPermitting & engineeringStamped plan setsInspectionAerial thermal and ELShading analysisSA, TOF and TSRFSurvey locationsState and metro guides

The platform

Platform overviewPortal, 3D models, live dataShading analysisMove the sun yourselfCost calculatorWhat bad field data costs you

Sign in

Vanguard AccessInvite only · survey data portalScheduling & DispatchCrewLink · all verticals

Field Notes · build vs. buy

What a survey really costsPart 01 · the full modelUtilization is the whole gamePart 02 · a real TuesdayThe break-even headcountWhen hiring pays offTwo technicians, two roofsVariance, measuredThe hybrid crewIn-house plus outsourced

Field Notes · reference

Site survey checklistBuilt backwards from reworkHow long a survey takesHour by hourDo panels need a permit?What goes in the packageStorage site surveysThe capture listCompare survey vendorsQuestions to ask any vendor

Company

All servicesAll Field NotesAboutBook a 15-min call

Home  /  Field Notes  /  AI site assessment

Field Notes · All verticals

AI tools for solar site assessment: what they see, and what they can’t

Imagery-based AI is good at the roof you can see from above. The rafters, the busbar and the meter are not in the picture. Here is where the line falls, and how to judge any AI tool before you design on its numbers.

Buyer’s guideAll verticals9 min read
Short answer

AI tools for solar site assessment use machine learning to turn imagery, LiDAR and site photos into roof geometry, obstruction maps and shade estimates. Three kinds of companies offer them: remote design platforms that read satellite or aerial imagery, geospatial siting platforms that screen land for larger projects, and survey providers that run AI over data captured on site.

Imagery-only AI is reliable for roof outlines, azimuth and early shade estimates. It cannot see rafters, sheathing, the busbar rating, the meter or roof condition. For a design you will permit and build, the strongest results come from AI applied on top of measured field data, with every number labelled measured or inferred and signed off by a person.

What counts as an AI solar site assessment?

The phrase covers very different products, and buyers get burned when they compare them as if they were one thing. The useful split is not which model a tool runs. It is what data the model is fed, because no model can report something its inputs never recorded.

Remote

Imagery-based AI

Reads satellite or aerial photos, and sometimes public LiDAR, to trace roof planes, estimate pitch and model shade. No one visits the site.

Siting

Geospatial AI

Scores parcels on land cover, slope, constraints and grid proximity. Useful for screening land, not for designing a roof or a string.

Field + AI

AI on measured data

A person captures the roof, attic and service to a fixed spec. Models then sort the photos, build the 3D roof and run the shade.

From above

What AI can reliably assess from imagery

Given sharp, recent imagery, a remote tool does a respectable job on the parts of a site that are visible from the sky:

  • Roof outline and plane layout. Ridges, hips, valleys and eaves are high-contrast edges, which is exactly what vision models are good at.
  • Azimuth. The direction a plane faces falls out of the outline and is usually solid.
  • Pitch, as an estimate. Pitch has to be inferred from stereo imagery, oblique views or LiDAR height points. How good it is depends on resolution and point density, so treat it as an estimate unless the tool states a tolerance.
  • Large obstructions and trees. Chimneys, dormers, skylights and big canopies show up. Small vents and stacks often do not.
  • A first shade estimate. Tree and building heights from LiDAR or 3D imagery feed a sun-path model that is good enough to qualify or drop a lead.

NREL has reviewed these remote methods in its report on estimating rooftop suitability for PV, and the conclusion holds up: remote data is a strong screening tool, and its accuracy depends on the input data. Two limits are easy to forget. Imagery has a capture date, so a tree that grew or a vent added since is not in it. And a model can be confidently wrong on unusual roofs: tile, low-slope sections, additions at odd pitches.

From inside

What still needs someone on site

Our site survey page puts it plainly: satellite imagery doesn’t know what’s in your attic. The data that decides whether a design can be permitted and built sits under the roof deck and behind the panel cover:

  • Rafter or truss size, spacing and span. The structural engineer needs members, not an outline. No image from above records them.
  • Sheathing, roofing layers and condition. Delamination, soft decking and a second layer of shingles show up at a cut edge or from the attic, not from orbit.
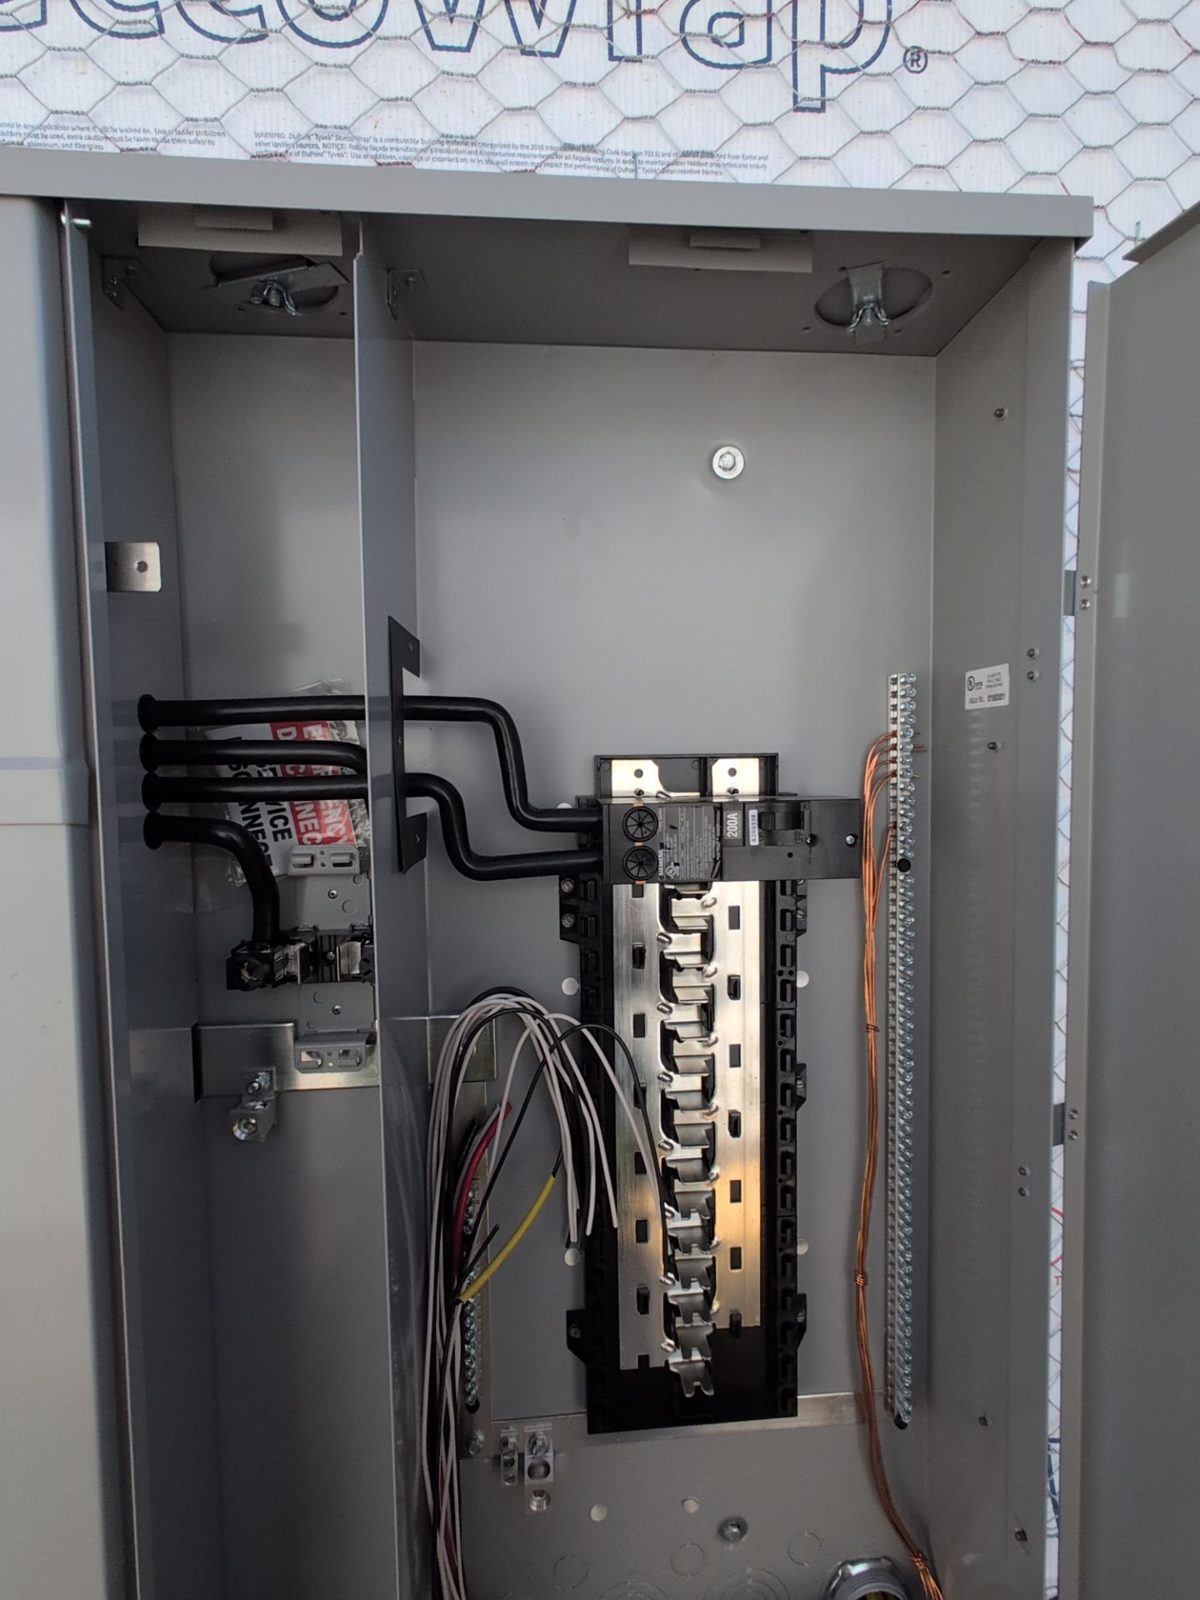
  • Main breaker and busbar ratings. For a load-side connection, the NEC 120% rule is calculated against the busbar rating, and the two labels often differ. Only an open panel answers it. The code text lives with NFPA 70.
  • Meter, service type and equipment locations. The utility application and the one-line both need them, and the conduit route depends on where things actually are.
  • Small obstructions and access. The vent stack exactly where row three was going, the locked side gate, the safe ladder point.

Miss any of these and the cost lands later: a second truck roll, a redesign after the homeowner has seen the layout, or a panel surprise on install day. The full minimum list, reader by reader, is in what a residential solar site survey actually needs.
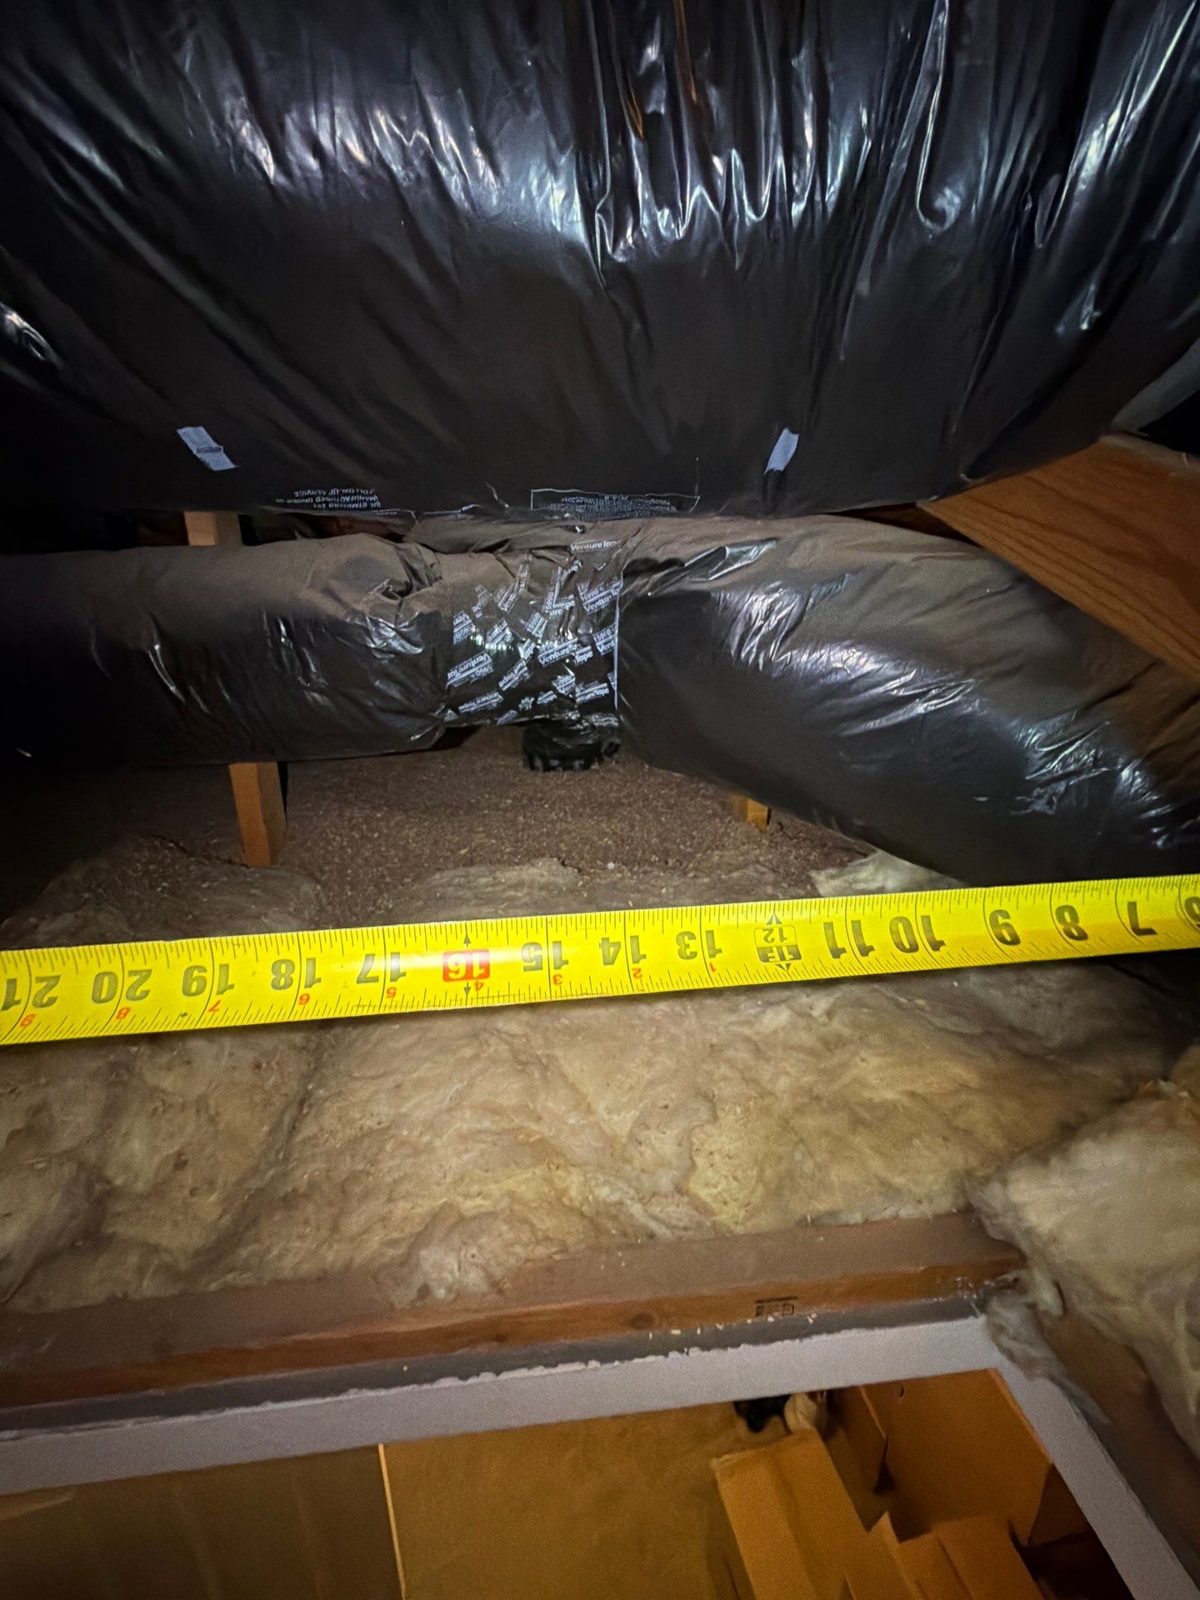
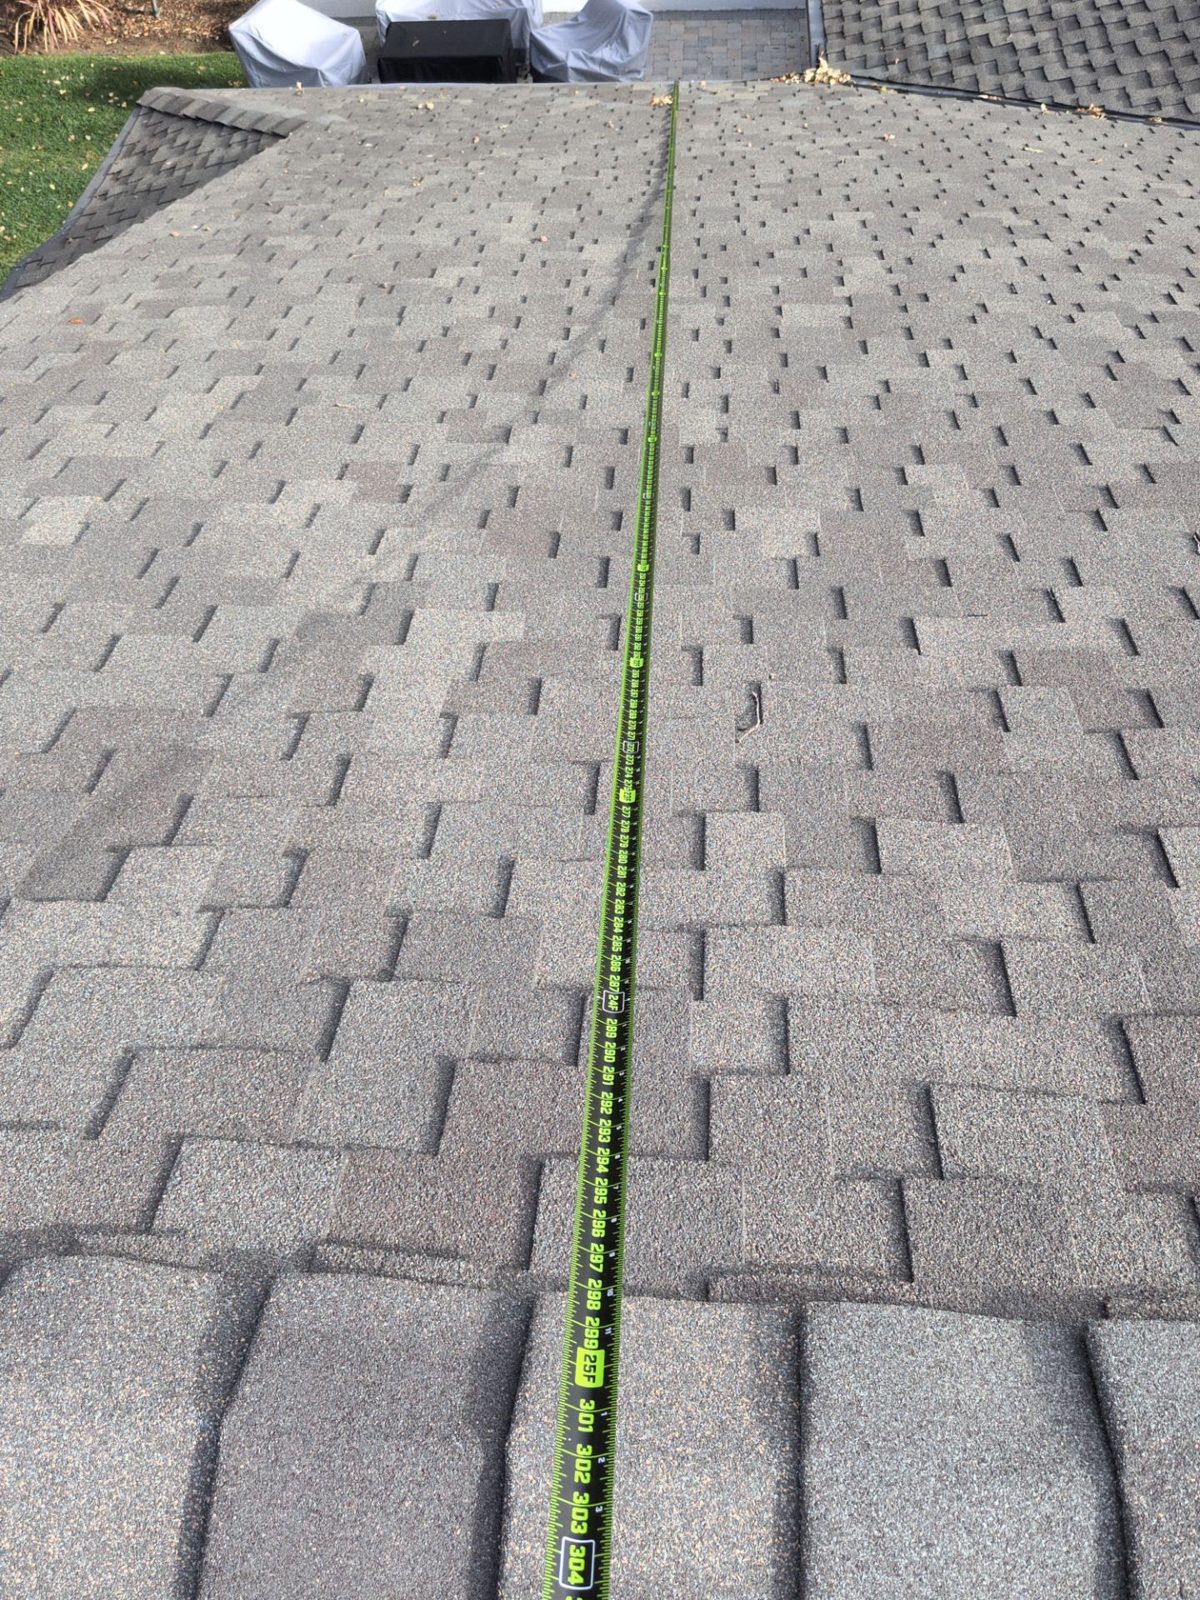
Tape measure stretched across attic framing between two members, above insulation and below flexible ducting
Attic · on site onlyMember spacing read off a tape in the attic. No imagery model can see this.
Residential meter-main service panel with the cover off, showing the main breaker and branch breakers
Service · on site onlyPanel open, so main breaker and busbar can be read as two labels.
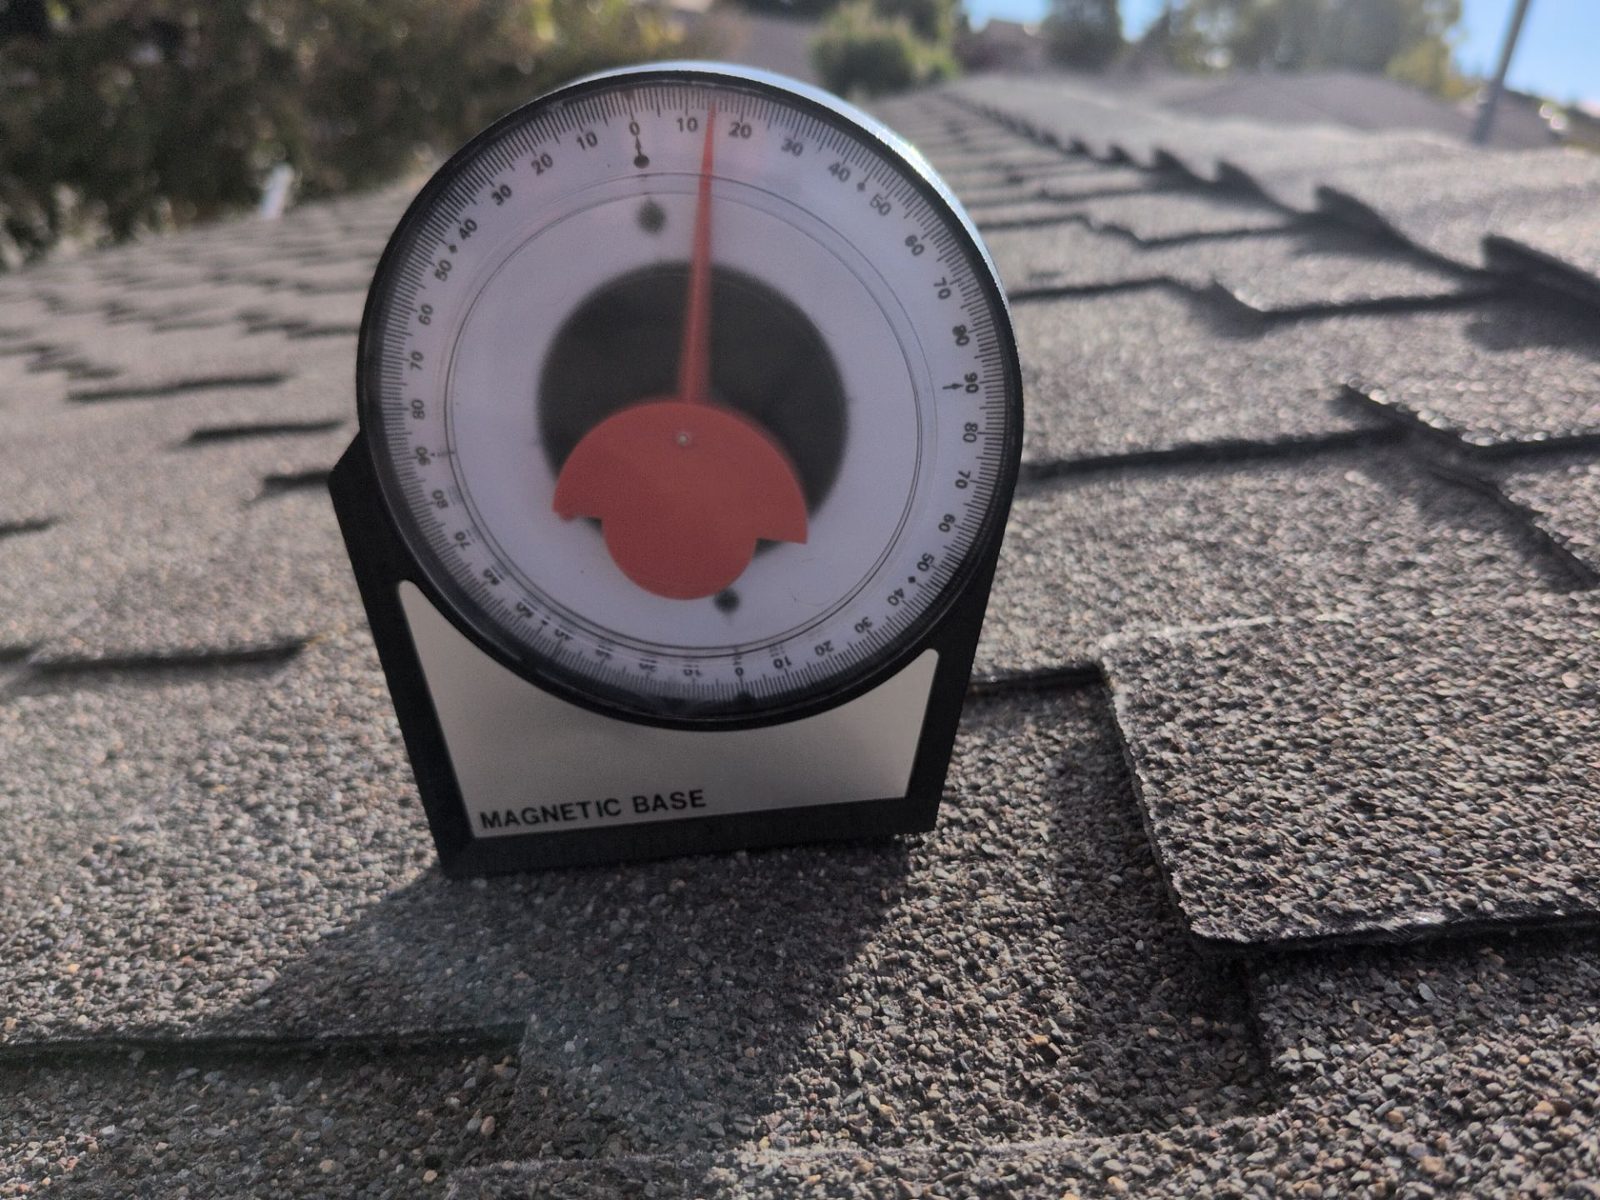
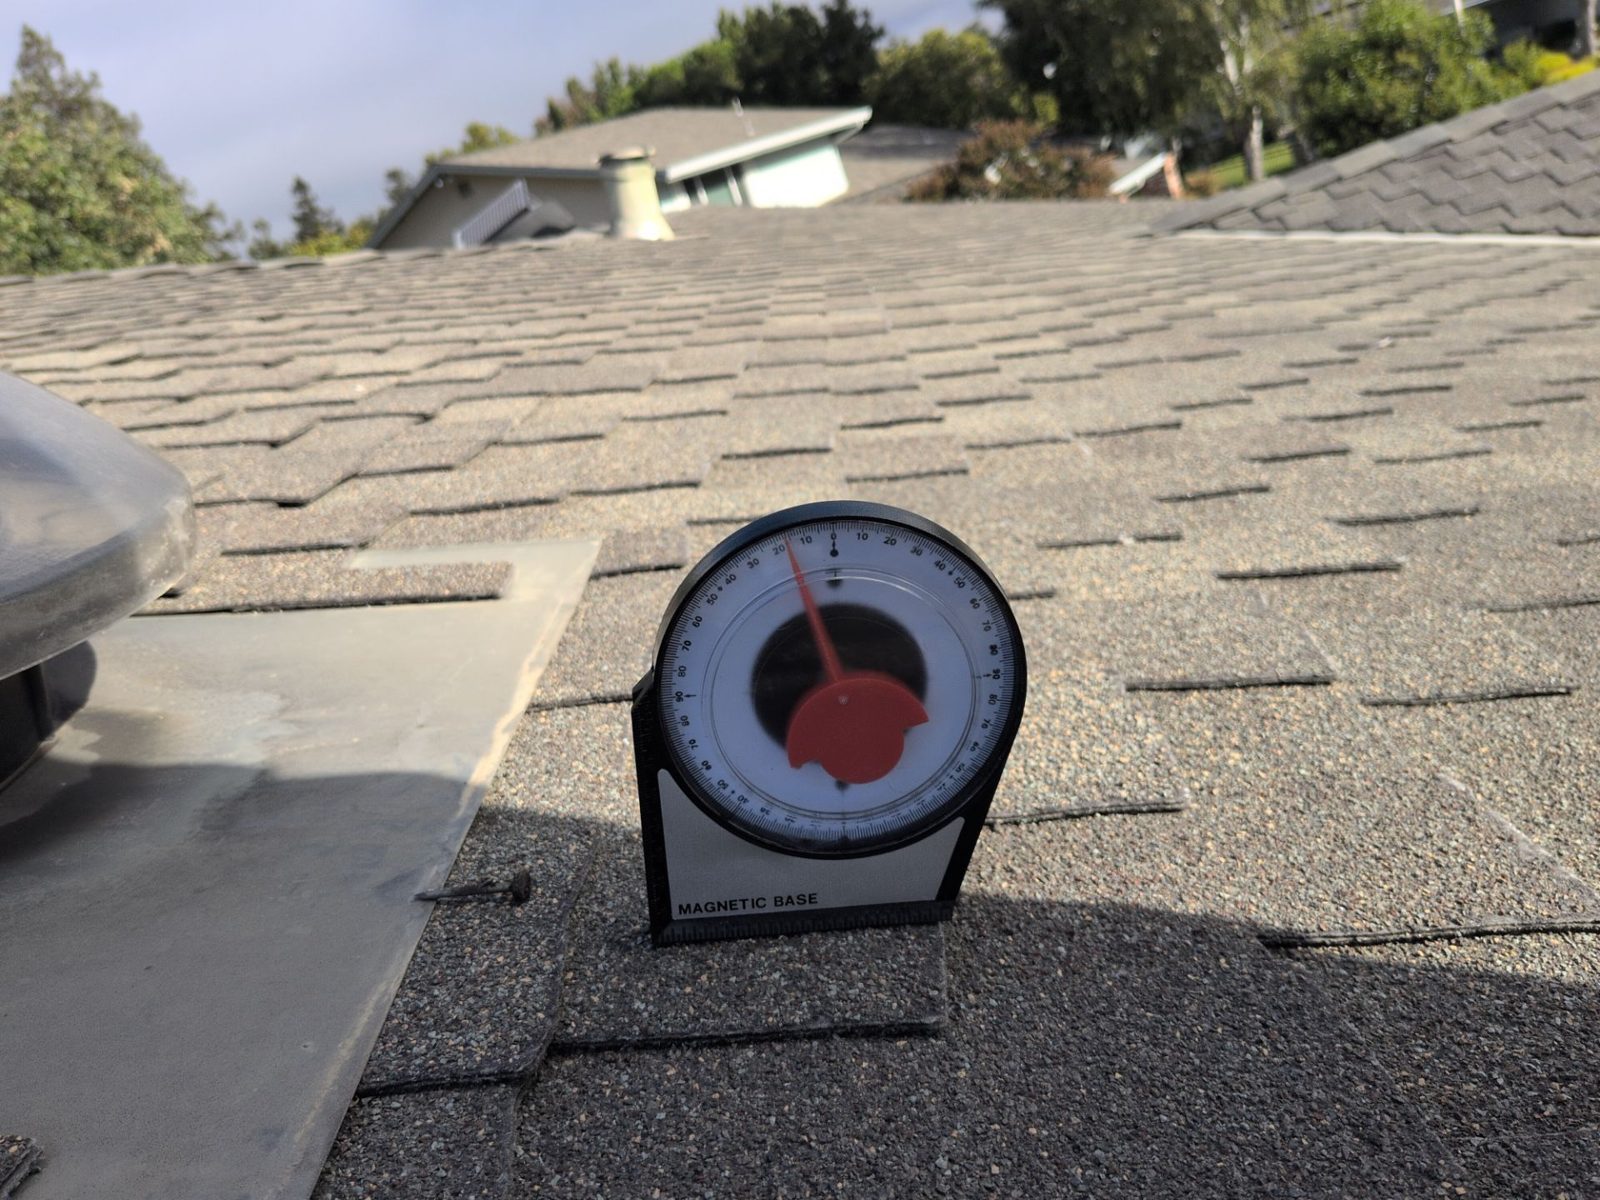
Magnetic pitch gauge seated on an asphalt shingle roof plane
Roof · measuredPitch read on the plane, a check on any modelled value.
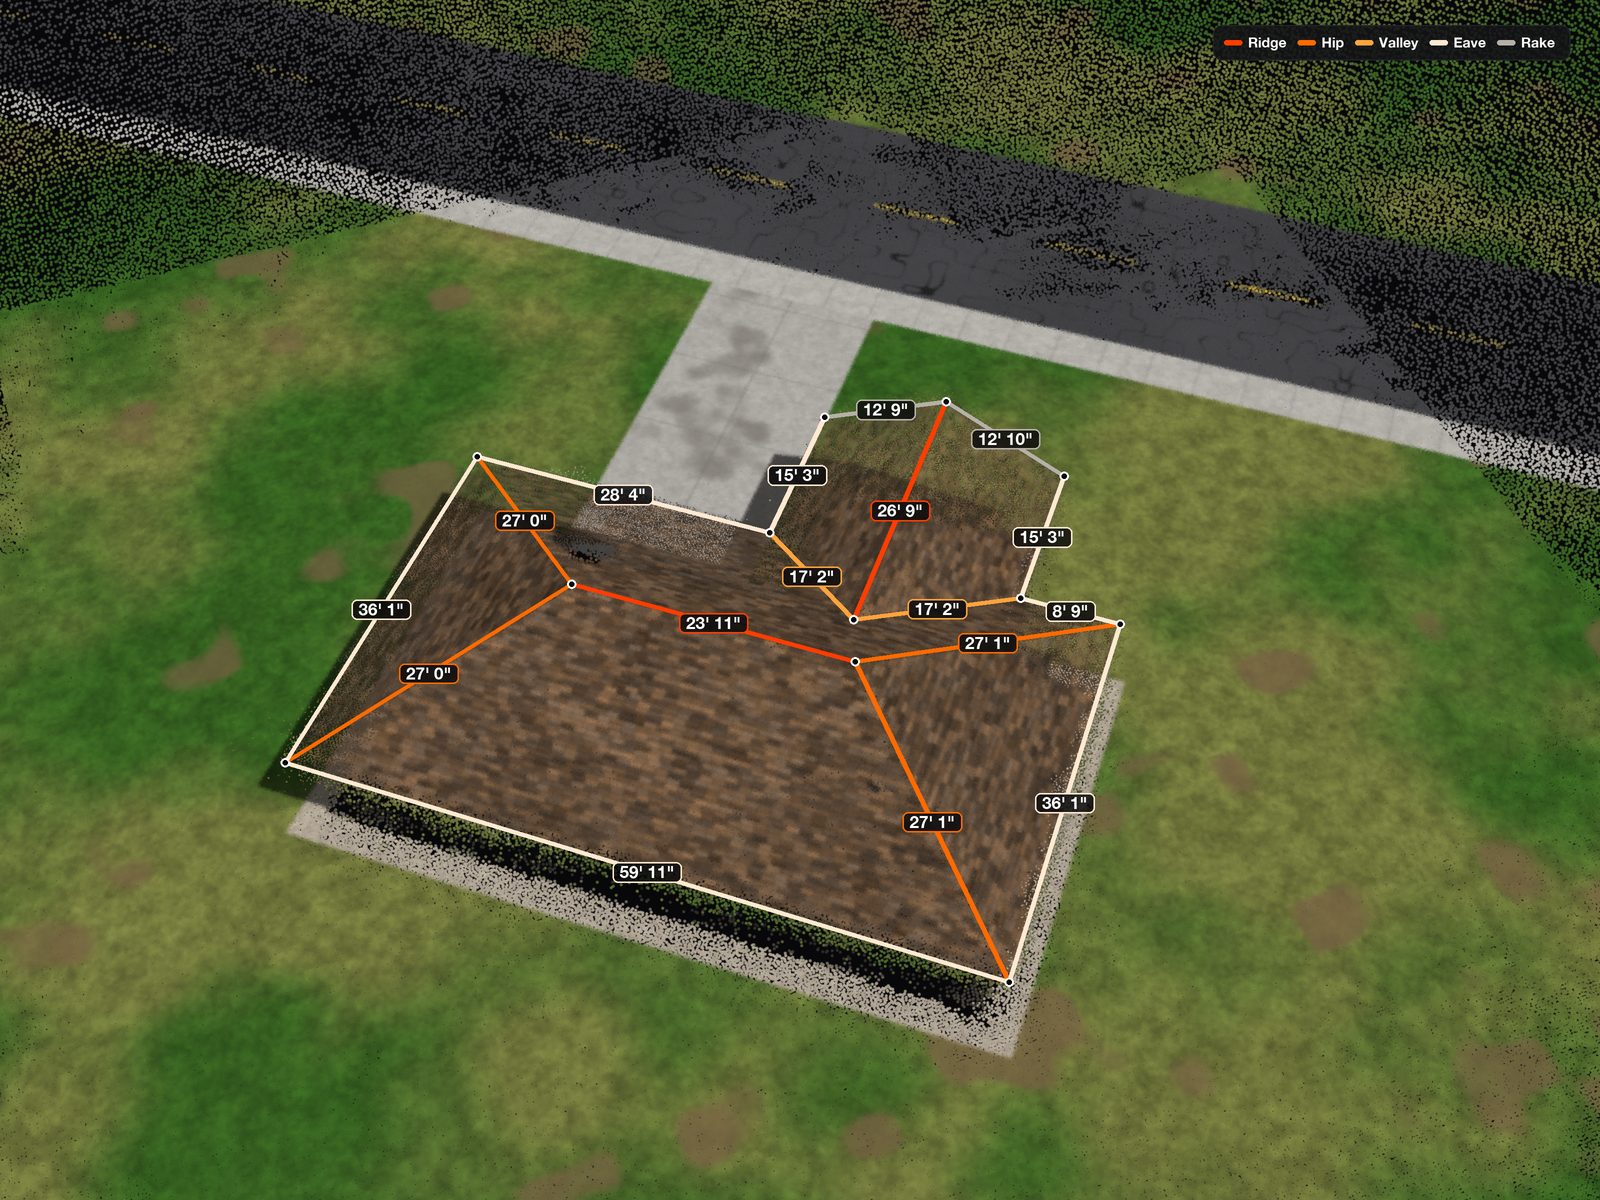
3D roof model from drone capture with ridge, hip, valley, eave and rake lengths labelled
Model · AI on field dataDrone capture becomes a 3D roof with every edge measured.
Interactive · confidence matrix

Imagery vs. on-site: switch the source

Pick a data source to see how much of a buildable design it can support. Tap any row for the reason.

2 / 12items at high confidence from imagery alone.

Qualitative editorial ratings for a typical residential roof. Not measured accuracy figures for any product.

Side by side

AI solar site assessment approaches, compared

None of these is wrong. Each is right for a different stage of the job. The mistake is using a screening tool’s output as if it were a design input.

Approach by approach
ApproachInputsReliable forCannot tell youBest stage
Imagery-based AISatellite or aerial photosRoof outline, azimuth, rough layoutStructure, electrical, condition, small obstructionsSales proposal
LiDAR and 3D aerial modelsPublic LiDAR, aerial 3D dataPitch estimates, tree heights, first shade numbersAnything under the roof or behind the panel; changes since captureQualifying a lead
Geospatial siting AIGIS layers: land cover, slope, parcels, gridScreening land at scaleRoof or structure detail; ground truth on siteEarly development
On-site survey, no AITechnician photos, tape, gaugeStructure, electrical, accessHour-by-hour shade; consistent measured modelDesign and permit
AI on measured field dataOn-site capture plus droneAll of the above, each number labelledOnly what the visit missed, and it should say soDesign, permit, engineering
The combination

Why AI works best on top of measured field data

A model’s output can only be as good as its input. Put AI on a satellite tile and you get fast, useful estimates of what is visible. Put the same kind of processing on a capture made on the roof, in the attic and at the panel, and it starts removing office work instead of adding risk.

After a visit, the time goes to someone scrolling hundreds of photos for the main breaker, re-drawing planes and running shade by hand. AI is good at exactly that work. The visit makes sure there is something real to process; the models make it usable, the same way every time.

Shade shows the split. A remote shade number is a fair screen. A model built from obstructions captured on site and run through every hour of the year belongs under a production estimate. One tells you whether to send a truck; the other tells you what to build.

Buyer’s checklist

How to evaluate AI tools for solar site assessment

Ask any vendor these questions, including us. A good tool answers every one without hand-waving.

  1. Does it disclose accuracy per measurement?A single headline accuracy number is not enough. Ask for the tolerance on each pitch, area and edge length, and how it was tested.
  2. Does it label measured versus inferred?Every value should say whether it came from a reading on site, a model estimate or an assumption. Rafter spacing in a remote report is always an assumption.
  3. What is the source and date of the imagery?Ask how old the capture is and what happens when the site has changed since.
  4. Is there human QA before delivery?Ask who signs off, what they check and what gets sent back.
  5. Is there an audit trail?Each number should trace to a photo or data point you can open: GPS-tagged, time-stamped and filed where you can find it.
  6. How does it handle missing data?A good report flags a skipped attic or an inaccessible panel. A bad one fills the gap silently.
  7. Is it checked against ground truth?Ask whether outputs are compared against measured or as-built results, and whether changes that make accuracy worse are blocked.
  8. Who approves it, and who sees your data?Ask whether program, lender or engineering review is complete, and whether your sites are visible to anyone outside your company.
Where we fit

How Solar Survey AI approaches it

We are the third kind of company in the short answer: AI on measured field data. Our platform starts with a technician on the roof, in the attic and at the panel, and a drone over the top, capturing GPS-tagged photos to one fixed spec. The photos are sorted into structural, electrical and drone sets and pinned to where they were taken. The drone photos become a 3D model, and every roof section gets its pitch, azimuth, area and edge lengths, with each measurement’s tolerance shown next to it. The site lands in your portal once QA signs off.

Our shading analysis walks the sun through all 8,760 hours of a typical year using the trees and obstructions actually captured on site, weighted by typical-year NREL weather, and reports solar access, TOF and TSRF per roof section. The math is published, an accuracy suite runs on every engine change, and reports are marked as not yet program- or lender-approved until independent engineering review is complete. Remote shade reports from public LiDAR and aerial data, for pre-qualification, are coming soon.

The platform is in beta for select clients, and each client sees only its own sites. The site survey itself covers roof and electrical in one visit, with the deliverable 48 hours later. More practitioner notes live in Field Notes.

Questions buyers ask

Who offers AI tools for solar site assessment?

Three kinds of companies: remote design platforms that analyse satellite or aerial imagery and LiDAR, geospatial siting platforms that screen land for larger projects, and survey providers that apply AI to data captured on site. Solar Survey AI is the third kind: technicians capture the roof, attic and electrical service, and our platform sorts the photos, builds the 3D roof model and runs the shade analysis.

Can AI replace a solar site survey?

Not for a design you intend to permit and build. Imagery-based AI can qualify a lead and draft a layout, but it cannot see rafters, sheathing, the busbar rating, the meter or roof condition. Those still need someone on site. AI is most useful processing what that visit captures.

How accurate is AI roof measurement from satellite imagery?

It depends on the imagery resolution, LiDAR point density, capture date and roof type, so there is no single number. Outlines and azimuth tend to be strong; pitch is inferred and varies more. Ask any tool for the tolerance on each measurement and how it was validated.

Does AI shade analysis replace an on-site shade capture?

A remote shade estimate is a good screen. For a production estimate you will stand behind, shade should be modelled from obstructions captured on site, per roof section and across the full year, because a tree that shades one plane can be invisible from another.

What should an AI site assessment report show?

Per-section geometry with tolerances, a clear label on every value saying whether it was measured or inferred, the imagery or capture date, who performed QA, and a link from each number back to the photo or data it came from.

Keep reading

See AI on your own field data

Bring us one project. We’ll survey it and show you exactly what lands in your portal.

Book a 15-min call
Book a 15-min call